

When traveling during the holiday season, there’s always a risk for weather disruptions and flight cancellations. Knowing which airports would be the best and the worst to be stranded in for an extended period of time seems like helpful information.
While the airports in the U.S. typically rank lower than many international airports for overall satisfaction and accessibility of public transit, there is still much to be said about the quality of U.S. airports. In fact, many studies show that the overall satisfaction at U.S. airports is at its highest level ever!
Everyone has their favorite (or least favorite) airport to visit. But when you look at the cold, hard facts, which are considered the best and worst?
TPG (The Points Guy) took a comprehensive look at the busiest 30 airports compiling data from multiple sources to pick definitive winners and losers.
The main categories that were considered in the calculations were
- Overall satisfaction scores
- Timeliness of flights (flight delays and cancellations)
- Ease of access to the city center (public transportation options, transportation costs, and time)
- Airport amenities (lounge access and Wi-Fi).
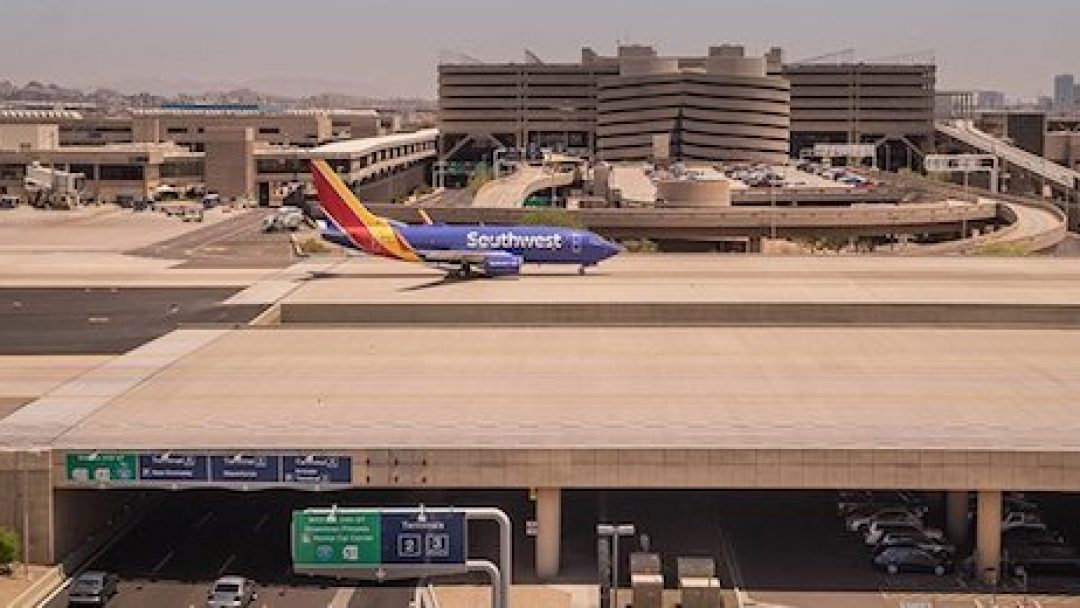
The ranking is conducted every other year due to the slow rate of changes at airports. Phoenix Sky Harbor’s on-time performance, proximity to downtown Phoenix and amenities such as nursing rooms, animal-relief areas, local restaurants and even spas put this Arizona airport on the top. Reviewers also loved Sky Harbor’s LEED certification and its commitment to environmental sustainability.
“All of this together helped Phoenix retain its first place status,” said Julian Mark Kheel, editorial director at The Points Guy.
If you’re a frequent flyer, they encapsulate both the best and worst of traveling: the majesty and mystery of yet-unconquered destinations and awe-inspiring aviation technology, and the ignominy of paying $20 at a newsstand for the world’s worst sandwich while trying to beat a gaggle of loud tourists to your gate. We love and we hate our airports, and we aren’t shy about playing favorites.
“And the answer is quite a lot, starting with how we conducted our study. We’re always working to refine our methodology and incorporate what we’ve learned, but rejiggering our formulas and criteria for what makes an airport great required us to do a little navel gazing and ask ourselves what’s important to our TPG staff and readers. High on that list is comfort and services, a category we expanded this year and rolled up, together with other factors, into a broader category we called “amenities.”
The other two categories we looked at this year were “accessibility” — how convenient each airport is to the local metropolis and area travelers — and “timeliness.” The latter reflects how good a job each airport does at getting passengers where they’re going. As in 2016, timeliness was the most heavily weighted category in our assessment. After all, if you’re an airport that can’t get travelers home, you’re really just a glorified mall with the world’s most depressing line to get in.
In some cases, we jettisoned old factors — every airport but one in our study offered some form of free Wi-Fi, for example — while adding new ones, like a “green score” for environmental initiatives and yet more opportunities for airports to climb the rankings with certain “quality of life” services (think: nursing stations, pet-relief areas and spa treatments).
As with all our TPG reports, we use purely objective data — no reader surveys or expert opinions, only quantifiable numbers and our own mathematical formulas. So, with our new definitions and focuses in hand, we reassessed each of the 30 busiest airports in America, from Hartfield-Jackson (ATL) to Portland International (PDX). What we found both surprised us and, at the same time, turned out precisely as we’d suspected.
The Best and Worst
The top and bottom scorers didn’t shock us, for the most part. The winners’ circle was full of familiar faces, including top-scoring Phoenix Sky Harbor (PHX), Salt Lake City (SLC), Portland and San Diego (SAN). And yet again, to no one’s astonishment, New Yorkers are saddled with the nation’s worst trio of airports, with New York-JFK neck and neck in a race to the bottom against neighbors LaGuardia (LGA) and Newark Liberty (EWR).
What’s Sky Harbor doing right? Like last time, it didn’t come in first in any one category but made strong showings in nearly all of them, including being easily reached by car or bus, having cheap parking, negligible wait times at security compared to other airports and respectably low delay and cancellation rates (though it could use more lounges for its size).
Though Salt Lake City had somewhat better timeliness scores overall, PHX was easier to get to. And though San Diego was the most accessible of all the airports we looked at (PHX came in second by a hair), Phoenix was in a higher tier for being on time. All the airports that beat PHX in the number of amenities they had couldn’t overcome other, sometimes fatal, deficits (especially JFK, San Francisco and LAX). Taken together, PHX arguably won not necessarily by coming in first anywhere, but by not having any crippling flaws.
JFK is this year’s worst airport, “beating” 2016’s worst airport, LGA, with nearly universally poor scores for delays (third worst), cancellations (fourth worst, though LGA was worst), the longest time to drive to from the center of the city (68 minutes!) and a three-way tie for the longest connection times with LAX and Daniel K. Inouye Airport (HNL) in Honolulu. It also came in dead last — by a lot — for rideshare score (expect to shell out as much as $80 for a trip from Midtown on a weekday afternoon, not even during rush hour). All of that was too much for the fact that JFK actually had the most lounges (unadjusted for number of passengers). The only other detail JFK had going for it was the fact that it actually wasn’t the most expensive place to park. That dubious honor, naturally, went to LGA.
The Most and Least Improved
Coming as more of a surprise were the airports that climbed or fell in our new valuations. Though PHX was the overall winner, Washington Dulles (IAD) was the most improved, jumping from an embarrassing 24th place in 2016 into the Top 10 this year (it’s now No. 8). We chalk this up to a number of factors, but the three that made the most impact had mostly to do with our new emphases: Dulles benefited from its notably high ratio of lounges to passengers, the new criteria for quality-of-life services and the fact that we placed less weight this year on how convenient an airport is to public transit. This change was made in order to better balance our ratings between airports that primarily function as an origin or destination against those that are used more as major connection hubs (though it’s worth noting that Dulles still has one of the worst public-transportation ratings on our list.)
Other notable improvements included Tampa (TPA), with fairly strong timeliness numbers; Denver (DEN), which also did admirably with getting planes in and out on time; and Detroit Metropolitan (DTW), which was helped out in no small amount by the fact that public transit counts for less.
The most surprising fall for us, on the other hand, was that of HNL in Hawaii, which went from No. 5 in 2016 to No. 13 in 2018. Honolulu fared badly in several of our new criteria, including in-airport quality-of-life services (Honolulu did worse than any other airport), green score (also among the worst) and rideshare score. Although we de-emphasized public transportation, it’s worth emphasizing that the only reason HNL didn’t come in dead last here was that Dallas/Fort Worth (DFW) did even worse. Honolulu’s saving grace was that the airport still posts enviably robust on-time numbers, which let it finish in the top half.
Others that did perceptibly worse than last time were Seattle-Tacoma (SEA), which had subpar scores both for amenities and accessibility; San Francisco (SFO), which did great with amenities but not so well with accessibility — figure out a better, cheaper solution for parking, guys — and tanked when it came to timeliness, with the second-worst score; Fort Lauderdale (FLL), with high delay and cancellation rates and long wait times in security; and LAX, which had the worst delay rates in the country.